
If you work in any environment with sick patients, you will inevitably encounter patients with right heart or right ventricular failure. I’m sure you’ve felt like I have, that these can be some of the most physiologically challenging patients to manage.
Knowing how to identify if a patient has significant right heart strain on point of care ultrasound (POCUS) and echocardiography can help you become aware of the severity of a patient’s condition. It may be the first step in figuring out if there are any further diagnostic or management steps you need to take to prevent the progression of right ventricular dysfunction.
Here is a list of some common conditions that can present with Right Heart Failure and Strain:
- Pulmonary Embolism
- Pulmonary Hypertension
- Left-sided heart failure
- ARDS
- Severe Tricuspid Regurgitation
- Volume Overload
In this post, I want to go over a very simple point of care ultrasound (POCUS) finding that can help you identify right heart strain in your patients called the “D Sign.”
Now you may have already heard of the “D Sign” for echo. However, some people may not realize that there are different variants of the “D Sign” that can help you identify right ventricular PRESSURE versus VOLUME overload on cardiac ultrasound. This post will help you clarify those differences!
I won’t be going over all of the pathophysiologic differences between the two forms of right ventricular overload, but will mainly focus on the echocardiographic findings of the D Sign on echo.
(For a more in-depth review of the pathophysiology, you should check out the article by Louie et al or the American Society of Echocardiography guidelines on right heart assessment)
Table of Contents
D Sign Ultrasound/Echocardiography Pocket Card PDF
Download D Sign Pocket Card HERE
Like this Post?
Sign Up For POCUS 101 Updates!

What is the D Sign on Ultrasound or Echocardiography
The “D Sign” is an ultrasound/echo finding that shows the left ventricle as a D-shaped structure. It is a result of right ventricular overload causing a shift of the septum towards the left side of the heart. The “D-sign” can be the result of either right ventricular Pressure and/or Volume overload.
To start looking for the D Sign on echo, you will need to obtain a Parasternal Short-Axis View of the heart. Click HERE for the video series on how to get the cardiac views of the heart on echocardiography.
Here are some examples of the D Sign on Ultrasound/Echocardiography:
RV Strain with D-sign in a patient with Massive PE 
RV Pressure Overload D Sign 
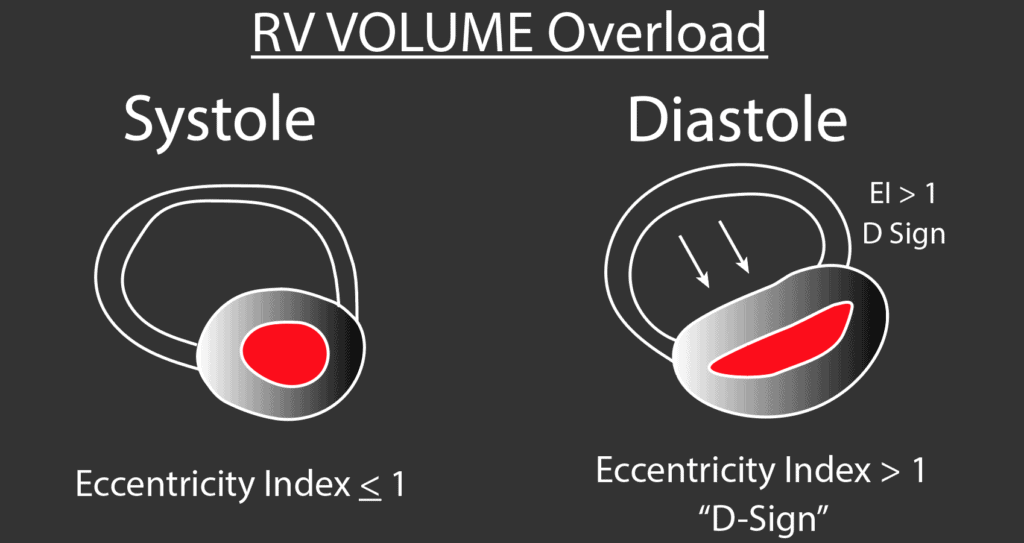
RV Volume Overload D Sign

Calculating the D Sign on Ultrasound using the Eccentricity Index
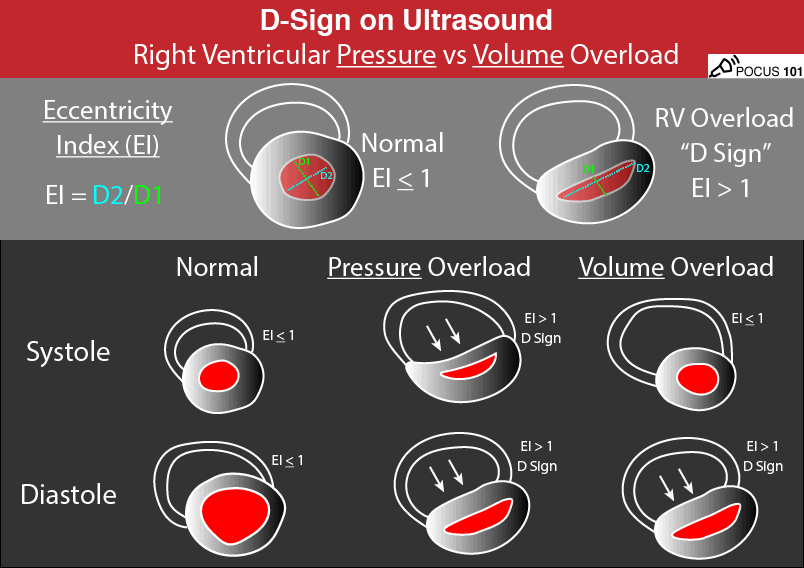
The Eccentricity Index (EI) is an echocardiographic measurement of the left ventricle that can quantify the amount of right ventricular strain and overload affecting the left ventricle. It is described by Ryan et al and is calculated by taking two measurements of the left ventricular cavity.
The first measurement (D1), is taken perpendicular to the septum and the second measurement (D2), is taken parallel to the septum. The eccentricity index is then simply calculated by the following equation: Eccentricity Index (EI) = D2/D1.
Here is how to interpret the Eccentricity Index:
- EI < 1: Normal
- EI > 1: Right Ventricular Overload with resulting “D Sign”

The Eccentricity Index calculation should be performed at BOTH end-systole and end-diastole to see if either or both parts of the cardiac cycle show signs of right ventricular overload. This will be important in differentiating between pressure versus volume overload.
Normal Patient with No Right Ventricular Strain or D Sign
In normal patients, the eccentricity index is 1.0 at both end-diastole and end-systole. Just remember that the left ventricle should look circular and if it is starting to look like an oval then it is probably showing signs of right ventricular strain.

D Sign with Right Ventricular PRESSURE Overload
In patients with right ventricular Pressure overload, there is a significant elevation of pressure in the right ventricle throughout systole AND diastole.
Because of this, the right ventricle will push in on the septum in both systole and diastole causing the left ventricle to be D-shaped (D Sign) throughout the cardiac cycles.
Therefore, in right ventricular Pressure overload, patients will have an Eccentricity Index significantly greater than 1.0 (with D Sign) in BOTH end-systole and end-diastole.


D Sign with Right Ventricular VOLUME Overload
In right ventricular Volume overload, only the diastolic phase is affected and the systolic phase is spared.
The thought is that, in right ventricular volume overload, the right ventricle fills with volume (diastole) at the expense of the left ventricle and causes the left ventricle to be deformed (D-shaped) in end-diastole. So most of the effects of volume overload are during the filling phase (diastole).
However, the effects of right ventricular volume overload on the left ventricle during systole are minimal. This is because the filling phase of volume (diastole) has already occurred. This will result in a more normal and circular-shaped left ventricle during end-systole.
Therefore, right ventricular Volume overloaded patients will have an eccentricity index > 1.0 (with D Sign) during end-diastole, and a normal eccentricity index (<1) during end-systole.

Like this Post?
Sign Up For POCUS 101 Updates!

Practical Uses of the D Sign in Clinical Practice
Right Ventricular Pressure Overload Patients with D Sign
Unfortunately, the D sign is not a specific sign for a specific pathology. It just tells you that the patient has signs of right ventricular pressure overload. So after identifying that your patient has right ventricular pressure overload, you will then need to determine the cause of the RV pressure overload and try to treat the underlying cause.
Here is a list of conditions that you should think about with D sign and Pressure Overload:
- Massive Pulmonary Embolism
- Pulmonary Hypertension
- Chronic Right Heart Failure with Hypertrophy
- Left-sided heart failure
- Acute Respiratory Disease Syndrome (ARDS)
The D sign is also a bad prognostic sign in patients with pulmonary embolism and indicates that the patient may have a massive pulmonary embolism with significant right ventricular strain.
Right Ventricular Volume Overload Patients with D Sign
The most common things that can cause volume overload in patients are severe tricuspid regurgitation, aggressive volume resuscitation, or decompensated heart failure. Identifying this early, can help you manage and titrate your volume resuscitation or diuresis.
Other Ways to Assess Right Heart Strain
Using the eccentricity index and the D Sign on ultrasound is just one way to assess right heart and right ventricular strain. Other methods to look at the severity of right ventricular dysfunction include Right Ventricle to Left Ventricle ratio (RV should not be larger than LV), Tricuspid Annular Plane Systolic Excursion (TAPSE), Right ventricular systolic pressure (pulmonary pressures), etc.
Case Study: Pulmonary Hypertension and the D-sign on Ultrasound
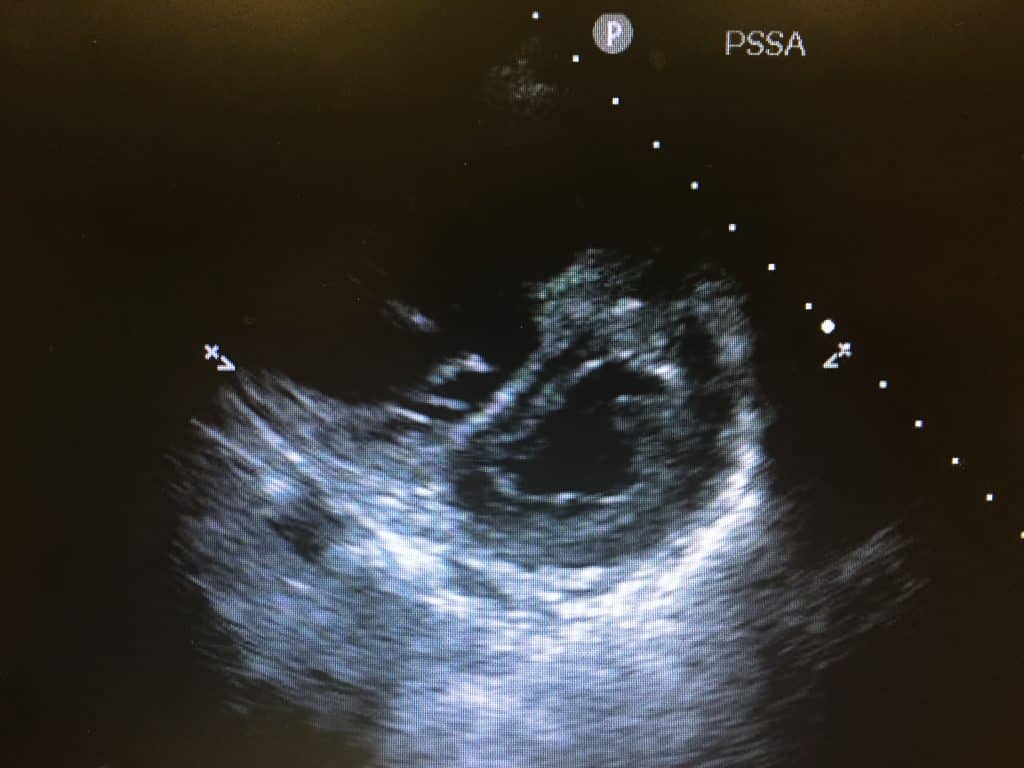
This is an example of a clinical case showing the D-sign that we encountered:
A patient in their 30’s, with a history of Pulmonary Hypertension, Vasovagal Syncope, Dyspnea On Exertion, and Chronic Systolic Right Heart Failure, was admitted for Right Heart Catheterization secondary to Pulmonary Hypertension. The symptoms in this patient included: chronic cough, bilateral lower extremities edema, orthopnea, dyspnea, chest pain, dizziness, tachycardia, hoarseness, and diaphoresis.
We performed a bedside ultrasound looking from right ventricle strain. The image below shows a parasternal short-axis view of the heart. We saw the “D-sign” which is formed when the interventricular septum is flattened during systole and diastole and forms D-shaped left ventricle. This is a sign of right ventricular enlargement and pressure-overload.
Assessment of the right ventricle size is part of a focused bedside heart ultrasound. A rule of thumb is that a right ventricle should be about ⅔ of the size of the left ventricle. If the right ventricle is the same size as the left ventricle, the right ventricle is moderately dilated. If the right ventricle is bigger than the left ventricle, the right ventricle is severely dilated. Even though we used a parasternal short-axis view, a 4-chambers apical view could also be used to assess right ventricular size.
Right ventricle size assessment is also used as a part of the workup in a patient with suspected Pulmonary Embolism. Weekes et al. showed that using echocardiography to detect right ventricular strain in the setting of PE has a sensitivity of 100% and specificity of 99%. This shows the accuracy of the bedside ultrasound to detect the right ventricular dysfunction.
Weekes et al. also evaluated the agreement between different observers over right ventricular dysfunction. Two emergency physicians and two cardiologists evaluated the images. There was an 83.9% agreement on right ventricular enlargement, 74.2% agreement on RV dysfunction and 71% agreement on the septal deviation. They concluded that the “Agreement was substantial for both severe RV enlargement and RV systolic dysfunction and moderate for septal deviation.” They used the following criteria to determine right ventricular dysfunction: “RV enlargement was present, with a right-to-left ventricular basal diameter ratio of 1.0 or higher and blunting of the apex of the RV in 2 or more different windows; RV systolic dysfunction was present if the tricuspid annulus moved toward the apex 10 mm or less and there was RV free wall hypokinesis, and septal deviation was present with any flattening or deviation of the ventricular septum toward the left ventricle.”
References
- Ryan, T., Petrovic, O., Dillon, J., Feigenbaum, H., Conley, M., Armstrong, W. (1985). An echocardiographic index for separation of right ventricular volume and pressure overload Journal of the American College of Cardiology 5(4), 918-924. https://dx.doi.org/10.1016/s0735-1097(85)80433-2
- Louie, E., Rich, S., Levitsky, S., Brundage, B. (1992). Doppler echocardiographic demonstration of the differential effects of right ventricular pressure and volume overload on left ventricular geometry and filling Journal of the American College of Cardiology 19(1), 84-90. https://dx.doi.org/10.1016/0735-1097(92)90056-s
- Rudski, L., Lai, W., Afilalo, J., Hua, L., Handschumacher, M., Chandrasekaran, K., Solomon, S., Louie, E., Schiller, N. (2010). Guidelines for the echocardiographic assessment of the right heart in adults: a report from the American Society of Echocardiography endorsed by the European Association of Echocardiography, a registered branch of the European Society of Cardiology, and the Canadian Society of Echocardiography. Journal of the American Society of Echocardiography : official publication of the American Society of Echocardiography 23(7), 685 – 713- quiz 786-8. https://dx.doi.org/10.1016/j.echo.2010.05.010
- Zochios, V., Parhar, K., Tunnicliffe, W., Roscoe, A., Gao, F. (2017). The Right Ventricle in ARDS. Chest 152(1), 181 – 193. https://dx.doi.org/10.1016/j.chest.2017.02.019
- Calderon, E., Mene-Afejuku, T., Valvani, R., Cativo, D., Tripathi, D., Reyes, H., Mushiyev, S. (2017). D-Shaped Left Ventricle, Anatomic, and Physiologic Implications Case Reports in Cardiology 2017(), 1-4. https://dx.doi.org/10.1155/2017/4309165
- Rana, B., Robinson, S., Francis, R., Toshner, M., Swaans, M., Agarwal, S., Silva, R., Rana, A., Nihoyannopoulos, P. (2019). Tricuspid regurgitation and the right ventricle: risk stratification and timing of intervention Echo Research and Practice -1(aop), R25-R39. https://dx.doi.org/10.1530/erp-18-0051
- Weekes AJ, Oh L, Thacker G, Johnson AK, Runyon M, Rose G, Johnson T, Templin M, Norton HJ. Interobserver and Intraobserver Agreement on Qualitative Assessments of Right Ventricular Dysfunction With Echocardiography in Patients With Pulmonary Embolism. J Ultrasound Med. 2016 Oct;35(10):2113-20. doi: 10.7863/ultra.15.11007. Epub 2016 Aug 8. PubMed PMID: 27503757.
- Weekes AJ, Thacker G, Troha D, Johnson AK, Chanler-Berat J, Norton HJ, Runyon M. Diagnostic Accuracy of Right Ventricular Dysfunction Markers in Normotensive Emergency Department Patients With Acute Pulmonary Embolism. Ann Emerg Med. 2016 Sep;68(3):277-91. doi: 10.1016/j.annemergmed.2016.01.027. Epub 2016 Mar 11. PubMed PMID: 26973178


Great article! Super informative! It is reported in your article that the rule of thumb is the right ventricle is 2/3 the size of the left ventricle. I have seen it reported in other articles that the right ventricle is 1/3 the size the left ventricle.
Hi Rebecca. Yes it depends on the literature you read 1/3-2/3. However regarding POCUS standpoint. As long as RV is smaller than LV it is usually okay. Once it starts getting larger and more hypokinetic that’s when you have to be suspicious of RV strain! Hope that helps. – Vi
Thanks so much. That makes perfect sense.
Thanks Rebecca. Glad it was helpful! – Vi
[…] again shows that the LV function is poor and there is no pericardial effusion. Is there a D-sign indicative of RV pressure or volume overload? No, the interventricular septum is bowing to the […]
[…] https://www.pocus101.com/the-d-sign-right-heart-strain-from-pressure-vs-volume-overload/ […]