

As a Point of Care Ultrasound (POCUS) enthusiast, you may dread the term “Ultrasound Physics” and wished there was a simple way on how to learn and understand the principles of ultrasound physics that are actually relevant to your clinical practice.
But many of the resources on ultrasound physics that you encounter may seem too technical or don’t actually relate to the clinical use of Point of Care Ultrasound (POCUS).
I totally understand what you’re going through and have seen countless POCUS learners just gloss over ultrasound physics because it seems “boring” or “irrelevant”.
However, learning basic ultrasound physics is essential if you want to really improve or perfect your POCUS skills. Don’t worry, we are going to make Ultrasound Physics and Artifacts simple, easy, and clinically relevant!
In this post I will show you an easy way to use Ultrasound Physics to:
- Understand how Ultrasound Creates a Picture for you
- Always Pick the Correct Ultrasound Probe based on Frequency
- Easily Understand Ultrasound Velocity, Impedance, Reflection, Refraction, Attenuation
- Understand Ultrasound Terminology or “Echogenicity”
- Understand the Doppler Modes (Color, Power, Pulse wave, Continuous Wave, Tissue Doppler)
- Understand how important Ultrasound ARTIFACTS are Created (with full list/images of examples)
Though beginners or experienced Point of Care Ultrasound users will find this post helpful, just think of this post as an “Ultrasound Physics for Dummies” guide or reference.
I’ll cover the most important concepts on how to understand Ultrasound Physics principles and Artifacts. Alright, let’s start your journey towards mastering Sonographic Physics and Artifacts in the easiest and most practical way possible!
Like this Post?
Sign Up For POCUS 101 Updates!

Table of Contents
What is the Definition of Ultrasound?
The definition of “ultrasound” is simply the vibration of sound with a frequency that is above the threshold of what humans can hear. The frequency of ultrasound is by definition, any frequency greater than 20,000 Hz. However, ultrasound used in medical practice is typically 1,000,000 Hz (1 Megahertz) or greater.
So the next time you pick up an ultrasound probe or transducer just notice what “Frequency” the probe is. It will usually range (termed bandwidth) between 2 Megahertz to 10 Megahertz. For example, 2.5-3.5 MHz for general abdominal imaging and 5.0-10 MHz for superficial imaging.
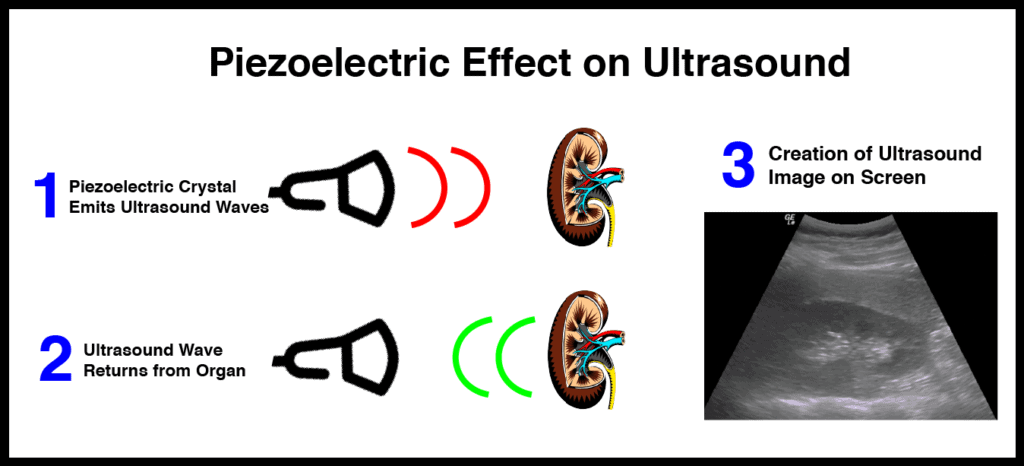
How Ultrasound Creates a Picture – The Piezoelectric Effect
Next let’s go over how an ultrasound device uses ultrasonic waves to create pictures on the screen for you.
It traditionally does this by using an effect called the “Piezoelectric Effect.” This is simply the vibration of a piezoelectric crystal at the tip of the transducer that generates a specific ultrasonic frequency to create ultrasound waves. (FYI These crystals are easily broken and cost thousands of dollars to replace. Think about that each time you drop a probe. Yikes!)
These ultrasonic waves can then penetrate through the body’s soft tissue and return to the transducer as reflected ultrasound waves. These returning waves are then converted into an ultrasound image on the screen for you to view.
Therefore, all ultrasound principles are based on the physics of “waves” and if you can understand some basic physics principles that pertain to waves, you can derive exactly how ultrasound images are formed, ultrasound artifacts are created, and even how to use more advanced ultrasound applications such as Doppler.
(Editor’s note: Many of the newer handheld ultrasound devices do not use the traditional piezoelectric effect to create ultrasound images, and instead use silicon chips. However, the concepts of waves still apply)
Ultrasound Physics Table
Here is an important ultrasound physics table you can reference that goes over the speed, density, acoustic impedance, and attenuation of ultrasound relative to specific tissue types. You’ve may recognize it from other resources but never understood how to use it.
Don’t attempt to memorize this table, just look at the trends. This will help you understand why certain tissues look brighter (echogenic) compared to others, why ultrasound waves get reflected/refracted, and how ultrasound artifacts are formed. We will go over the importance of the findings of this table throughout the post.
| Tissue or Material | Speed of Sound (m/s) | Acoustic Impedance (kg/[s m2]) × 10^6 | Density (g/cm3) | Attenuation (dB/cm/MHz) |
|---|---|---|---|---|
| Air | 330 | 0.0004 | 0.0012 | 12 |
| Fat | 1450 | 1.38 | 0.95 | 0.63 |
| Blood | 1575 | 1.66 | 1.055 | 0.18 |
| Liver | 1570 | 1.69 | 1.06 | 0.94 |
| Bone | 4080 | 7.75 | 1.9 | 15 |
What Ultrasound Physics do you Actually Need to Know?
There are a few simple ultrasound physics principles that you will need to know in order for you to optimize your use of ultrasound and to understand ultrasound artifacts. I’ll also introduce some important ultrasound physics formulas and equations to help you grasp the concepts such as artifacts and Doppler (no need to memorize this stuff). Just invest a little time into learning these basic ultrasound physics concepts and it will help you tremendously.
Just think of Ultrasound in terms of “Waves”
An ultrasound device creates images, simply by sending short bursts of “waves” into the body. Understanding how these waves behave will be helpful in understanding how to optimize your ultrasound settings and images. I’ll make it as simple as possible for you and just go over the things I have found to be most relevant to be able to use the ultrasound machine.
Frequency and Wavelengths
Now I’m sure you’ve heard the word “Frequency” a lot when it comes to ultrasound transducers. Such as high versus low frequency ultrasound probes. But what exactly does that mean? Okay let’s get some definitions out of the way:
Wavelength = length or distance of a single cycle of a wave.
Frequency = the number of sound wave cycles per second.
The equation for Frequency = Speed of sound wave/Wavelength
So you can see from the equation, as wavelength increases, frequency decreases (and vice versa). This is because Frequency is inversely related to wavelength. The SHORTER the wavelength the HIGHER the frequency and the LONGER the wavelength the LOWER the frequency.

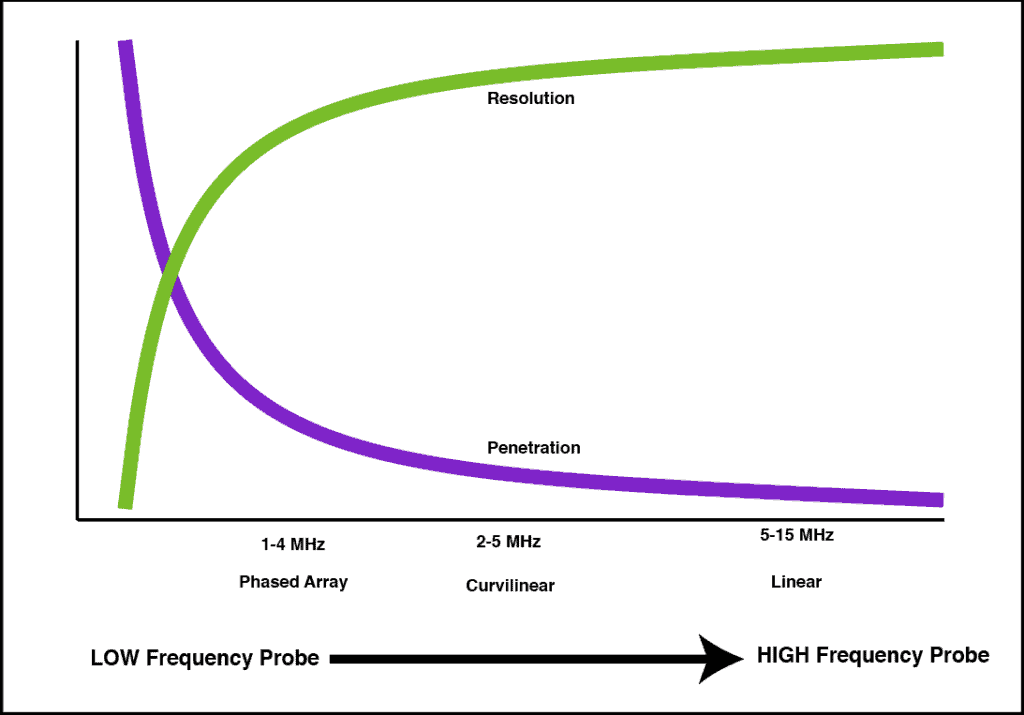
This is why higher frequency ultrasound probes will give you better resolution compared to a lower frequency probe. A high-frequency ultrasound probe will emit shorter wavelengths, so tissues will receive more ultrasound “waves” per unit of time with a high-frequency probe. However, the trade-off with high-frequency probes is decreased penetration because the piezoelectric crystal can only send so many ultrasound waves out before the waves dissipate.
Here is a graph showing the relationship between the frequency of an ultrasound probe and the resolution versus penetration it is able to achieve.
- Phased array probe: great penetration, okay resolution
- Curvilinear probe: good penetration, good resolution
- Linear probe: poor penetration, great resolution
Like this Post?
Sign Up For POCUS 101 Updates!
Speed of Sound In Different Mediums
Now the “speed of sound” is also often referred to with ultrasound. So why is the speed or velocity of sound so important?
Well, the exact speed of sound in specific tissue does not actually mean much to you clinically. However, the change in speed between two different mediums is extremely important. This is the essence of how ultrasound waves reflect and refract to create important ultrasound artifacts. So while you don’t need to know the exact speed of sound in certain tissue you do need to understand how the speed of sound changes between different mediums such as soft tissue, fluid, air, and bone.
The average speed/velocity of sound in all mediums is 1540 cm/s. However, depending on what medium the sound waves travel through, it can drastically change the propagation speed of sound as it passes through.
Two of the factors that affect the speed of sound are the stiffness and density of the material it is traveling through. The stiffer the medium, the faster the sound waves will travel and that is why sound waves travel faster in solids than in liquids or gases. So the ultrasound propagation speed from slowest to fastest is: Lung (air) << Fat < Soft tissue << Bone. This happens because stiffer mediums have tighter particles to propagate the ultrasound wave and therefore the velocity is greater.
Acoustic Impedance – Reflection and Refraction
Acoustic Impedance is the Resistance to Ultrasound Propagation as it Passes Through a Tissue
Acoustic Impedance is probably one of the most confusing terms when trying to learn ultrasound physics.
Acoustic Impedance (Z) is actually a physical property of a medium or tissue. It is dependent on the tissue density and the speed of sound through that tissue.
Impedance = Density x Propagation Speed of Sound Wave
So if the density of a tissue increases, the impedance (resistance) will increase as well. Refer to the ultrasound physics table again:
| Tissue or Material | Speed of Sound (m/s) | Acoustic Impedance (kg/[s m2]) × 10^6 | Density (g/cm3) | Attenuation (dB/cm/MHz) |
|---|---|---|---|---|
| Air | 330 | 0.0004 | 0.0012 | 12 |
| Fat | 1450 | 1.38 | 0.95 | 0.63 |
| Blood | 1575 | 1.66 | 1.055 | 0.18 |
| Liver | 1570 | 1.69 | 1.06 | 0.94 |
| Bone | 4080 | 7.75 | 1.9 | 15 |
Reflection of Ultrasound Waves
The importance of Impedance in ultrasound becomes apparent at the interface of two tissue types with significantly different impedance values. Ultrasound waves will reflect when this situation occurs. The proportion of ultrasound waves reflected back is proportional to the difference in impedance (or density) of two tissue types
REFLECTION occurs with ultrasound waves when two adjacent tissues have Significantly Different Impedance Values.
This is why bone and air appear as bright lines on ultrasound and also why you get the reflected “A-Lines” with pulmonary ultrasound. There is such a large difference between impedance of tissue and bone/air that they will cause almost all of the ultrasound waves to reflect back instead of penetrating through. What is interesting is that the impedance values of Air (extremely low at 0.0004) and bone (very high at 12), both cause reflection because of its drastic difference from the impedance of soft tissue (approximately 1.6).


We will go into more detail on the artifacts caused by reflection in the detailed Ultrasound Artifacts Section below but they include: reverberation artifact, mirror image artifact, comet tails, and ring down artifact.
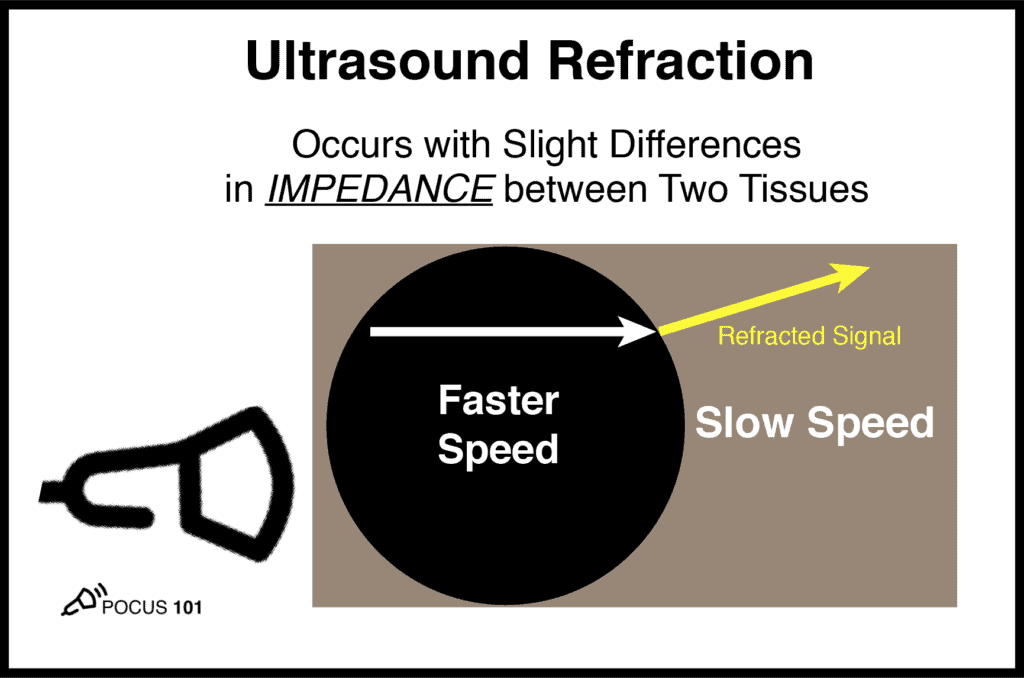
Refraction of Ultrasound Waves
REFRACTION occurs with ultrasound waves when two adjacent tissues have Slightly Different Impedance Values.
So when ultrasound waves travel through tissue and meet another tissue with slightly different impedance values, the speed changes somewhat and cause the ultrasound waves to change in direction. This change in direction is called Refraction!
The degree of how much refraction occurs is dependent on what angle the ultrasound wave encounters the second medium and how much of a change in speed there is in the second medium. This is seen mostly in situations at the rounded interfaces between a fluid-filled circular structure and the adjacent soft tissue. This is what gives rise to the edge artifact seen in ultrasound with black lines arising from the edge of fluid-filled structures such as the gallbladder, cyst, vessels, and bladder.

Attenuation – Absorption
ATTENUATION is the Loss and Absorption of Ultrasound Energy Through a Medium
Attenuation is a fairly easy concept to understand compared to impedance. It just describes how rapidly does a medium reduce the intensity of an ultrasound wave as it passes through it. The two mediums with the highest amounts of attenuation are actually AIR and BONE!
As you can see attenuation is not simply dependent on the density of the material like impedance is. Look at ultrasound physics table below to see the relationship between tissue density, impedance, and attenuation:
| Tissue or Material | Speed of Sound (m/s) | Acoustic Impedance (kg/[s m2]) × 10^6 | Density (g/cm3) | Attenuation (dB/cm/MHz) |
|---|---|---|---|---|
| Air | 330 | 0.0004 | 0.0012 | 12 |
| Fat | 1450 | 1.38 | 0.95 | 0.63 |
| Blood | 1575 | 1.66 | 1.055 | 0.18 |
| Liver | 1570 | 1.69 | 1.06 | 0.94 |
| Bone | 4080 | 7.75 | 1.9 | 15 |
This is the reason that ultrasound waves can’t pass through air or bone. The ultrasound waves either get reflected back (impedance mismatch) or gets absorbed (high attenuation).
Attenuation will account for the “Shadowing” artifact seen in bone or gall stones.


Like this Post?
Sign Up For POCUS 101 Updates!

Basic Ultrasound Terminology: “Echogenicity”
So if you want to speak the “language” of ultrasound, you will need to refer to specific structures on an ultrasound image based on it’s “Echogenicity.”
“Echogenicity” refers to how bright (echogenic) a tissue appears on ultrasound relative to another tissue.
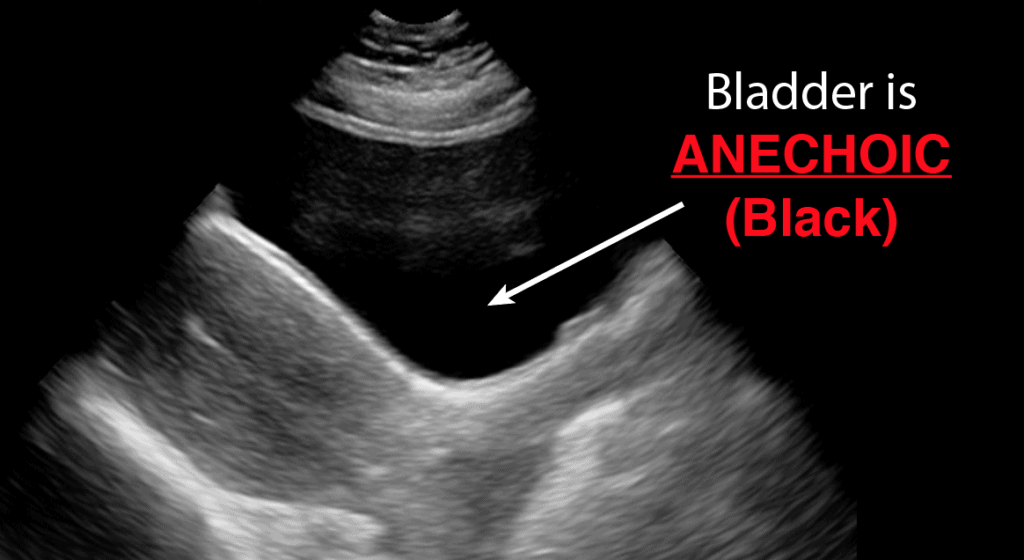
ANechoic (Black)
The term “Anechoic” on ultrasound means no internal echoes are emitted and there is a completely black appearance. This is most commonly seen with fluid-filled structures since ultrasound waves pass through fluid without reflecting any echoes back to the ultrasound machine.
Here is a list of structures that appear “Anechoic” or black on ultrasound: blood (unclotted), bladder, transudative pleural effusions, ascites, simple cysts, gallbladder.
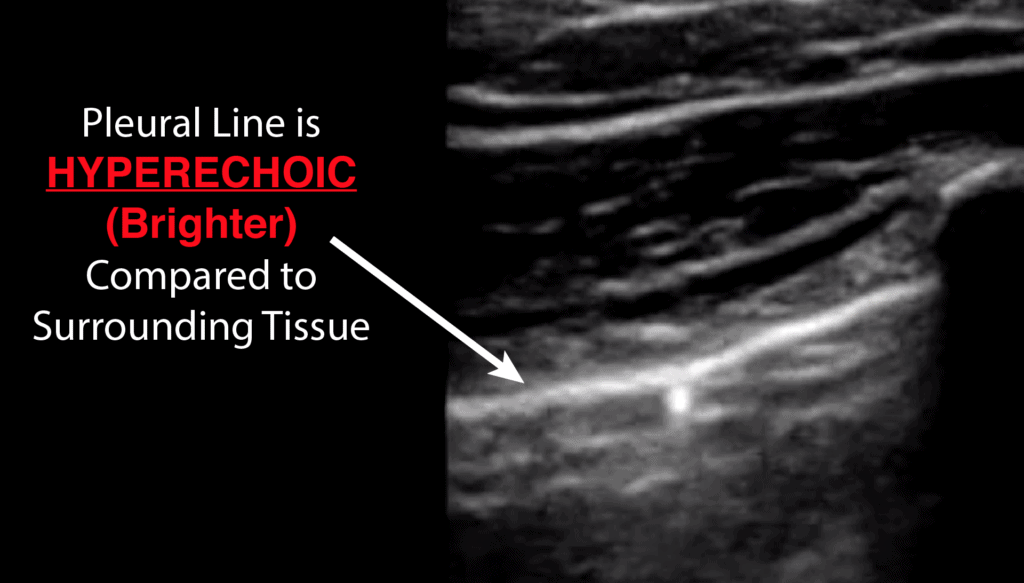
HYPERechoic (Bright/White)
The term “Hyperechoic” on ultrasound means that a specific structure gives off MORE echoes relative to it’s surrounding structures resulting in a brighter/whiter appearance. Below is an example of the pleural line which is “Hyperechoic” (bright/white) compared to the surrounding soft tissue.
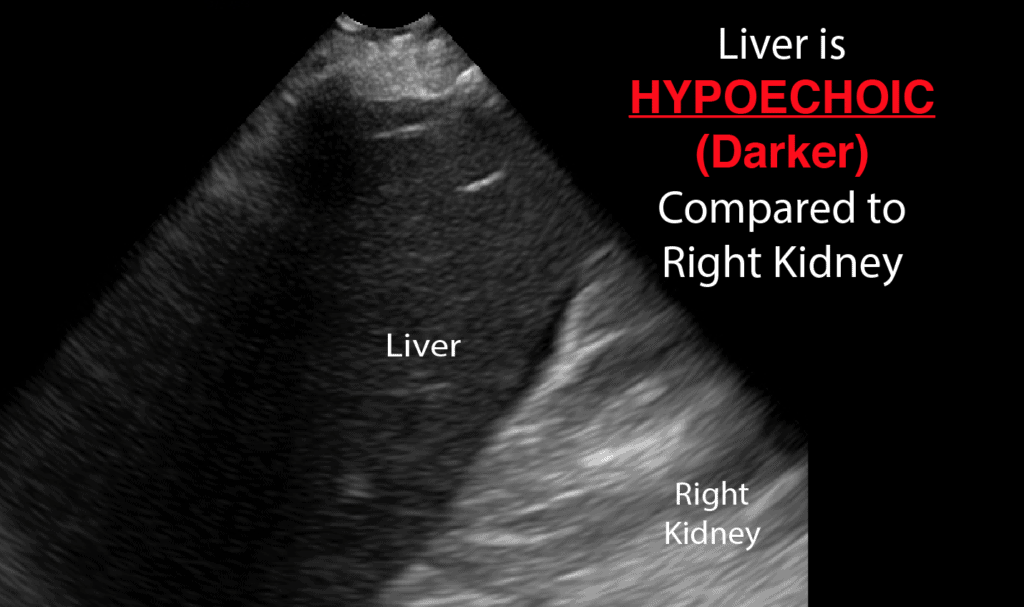
HYPOechoic (Darker/Grey)
The term “Hypoechoic” on ultrasound means that a specific structure gives off fewer echoes relative to it’s surrounding structures resulting in a darker or more grey appearance.
In the image below this patient has hepatitis with a Hypoechoic (darker) appearing liver compared to the right kidney:
ISOechoic (Similar)
The term “Isoechoic” on ultrasound means that a specific structure gives off similar echoes relative to another structure on the ultrasound screen. For example, you may say the Renal Cortex is isoechoic to the Spleen Parenchyma like the image below:

Ultrasound Doppler Made Easy
One of the most used modes with ultrasound is Doppler. Initially, Doppler may seem confusing with all of the different Doppler modes available to you (color Doppler, power Doppler, pulse wave Doppler, continuous wave Doppler, and tissue Doppler).
But if you just think of Doppler signals as detecting the speed of movement either Towards or Away from your probe you can derive all of the different Doppler ultrasound modes.
The Doppler Effect (or Doppler Shift) is used to evaluate movement either towards or away from the ultrasound probe/transducer. The most common Doppler ultrasound application we think of is detecting movement of blood, but we can also use Doppler on ultrasound to evaluate tissue and muscle movement.
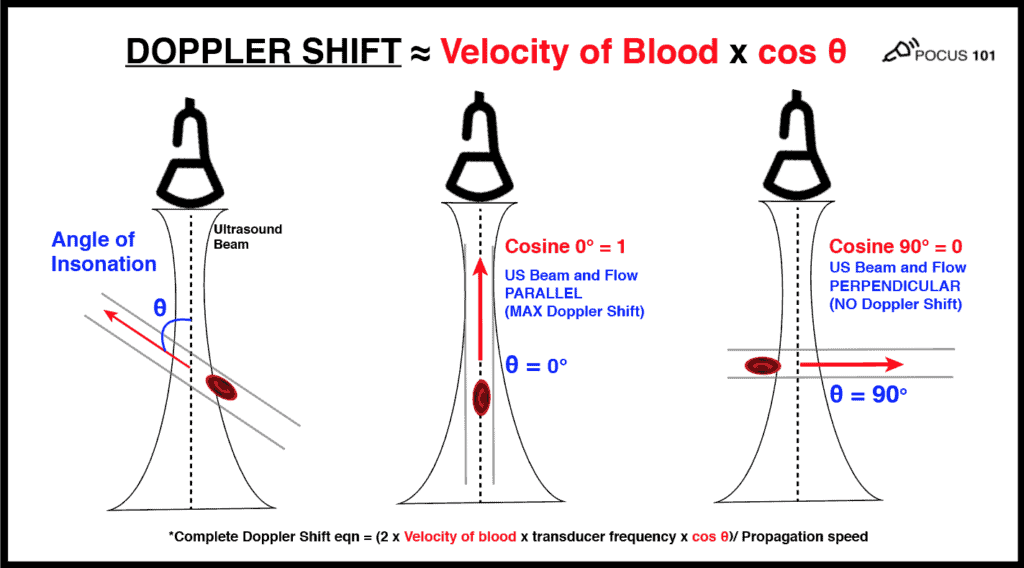
Doppler Shift Equation:
Doppler Shift = (2 x Velocity of blood x transducer frequency x cos θ)/ Propagation speed
*θ = Angle of Insonation (angle of incidence between the ultrasound beam and the direction of flow)
So the Doppler shift is mainly related to TWO things:
- The Velocity of the blood cells
- The Angle of Insonation
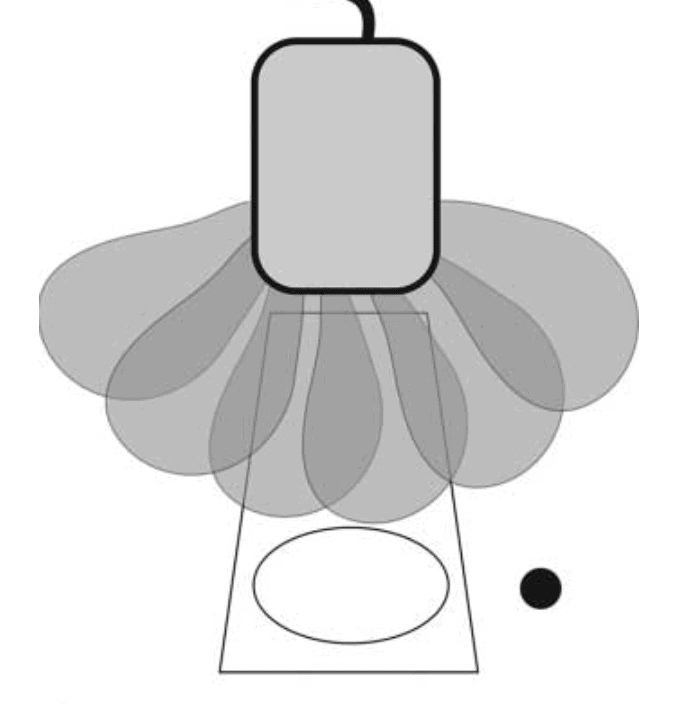
Below is a figure detailing how the Doppler Shift is used and how the angle of insonation is extremely important in what the transducer will detect as the amount of flow/movement. For any type of Doppler you want the flow/movement to be going directly towards your probe (zero degrees) as you move more towards a 90 degree angle there will be no flow detected by the ultrasound machine.
(Editor’s note: I’m using the velocity of blood as the example here. But the same principles apply if you are measuring muscle movement using tissue doppler. Check out the diastology post to learn more about tissue Doppler. )
So the most important thing you can do to improve your Doppler technique for any mode is to make sure that the movement of whatever you are measuring is parallel to your ultrasound probe as much as possible (zero degrees). Anything above 25-30 degrees will significantly underestimate your measurements. And if you are perpendicular, the cosine of 90 degrees = 0 and the ultrasound Doppler will read no flow or movement.
Color Doppler
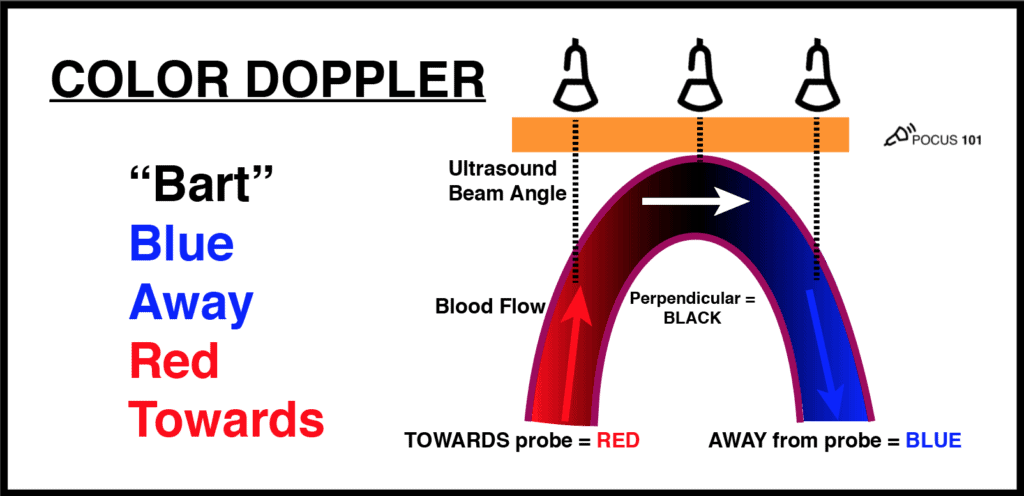
The most common Doppler mode you will use is color Doppler. This mode allows you to see the movement of blood movement in arteries and veins with blue and red patterns on the ultrasound screen.
A common question that comes up with color Doppler is: What do the colors on ultrasound mean? The answer is: RED means there is flow TOWARDS the ultrasound probe and BLUE means that there is flow AWAY from the ultrasound probe. It is a misconception that red is arterial and blue is venous. It actually just depends on the direction blood is flowing relative to the angle of your ultrasound beam.
An easy way to remember this is to use the BART mnemonic: Blue AWAY, Red TOWARDS.
There is a mode similar to color Doppler that you may encounter called Power Doppler. This mode does not show up as red or blue on the screen but only uses a single yellow color signifying the amplitude of flow. It is more sensitive than color Doppler and is used to detect low flow states such as venous flow in the thyroid or testicles.
The “Other Doppler Modes”
Now some learners may feel like the “other doppler modes” such as Pulse wave, Continuous wave, and Tissue Doppler are very advanced settings. However, the same principles of color Doppler apply to these other Doppler modes as well. The ultrasound probe is just detecting flow or motion either TOWARDS or AWAY from it. If it is towards the probe there will be a positive deflection and if it is away from the probe there will be a negative deflection.
Here is an illustration that sums up the those Doppler modes:
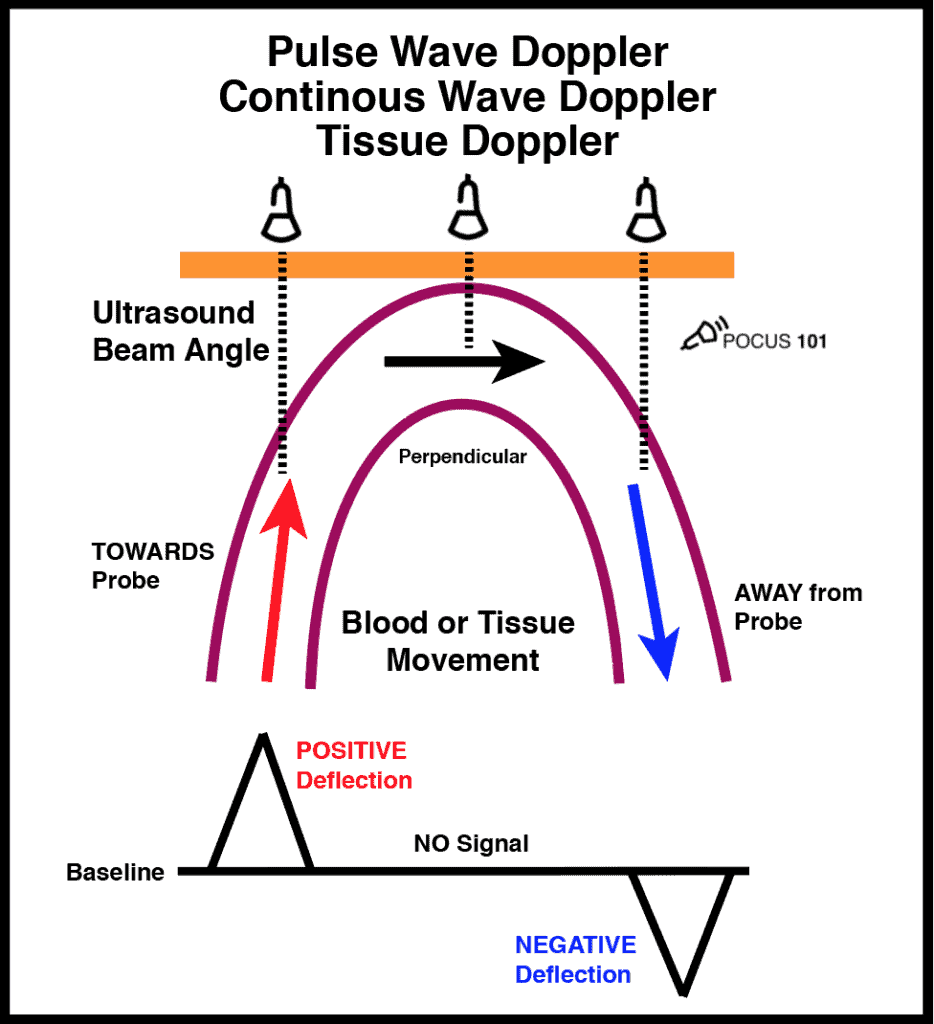
Going through each of these Doppler modes is beyond the scope of this post. However, if you want a good explanation of exactly how Pulse Wave Doppler and Tissue Doppler are used, check out the diastolic dysfunction post HERE.
Like this Post?
Sign Up For POCUS 101 Updates!
Essential Ultrasound Artifacts
Ultrasound artifacts are frequently encountered and can be a source of confusion for interpreting providers. Ultrasound artifacts can be understood with a basic understanding of the ultrasound physics we just discussed pertaining to reflection, refraction, and attenuation.
The ability to recognize and fix correctable ultrasound artifacts is important for getting quality ultrasound images and optimizing the care of your patients.
Here are the main ultrasound artifacts we will cover:
- Mirror Image Artifact
- Acoustic Shadowing Artifact
- Posterior Acoustic Enhancement
- Edge Shadowing Artifact
- Reverberation Artifact
- Comet Tail Artifact
- Ring Down Artifact
- Side Lobe Artifact
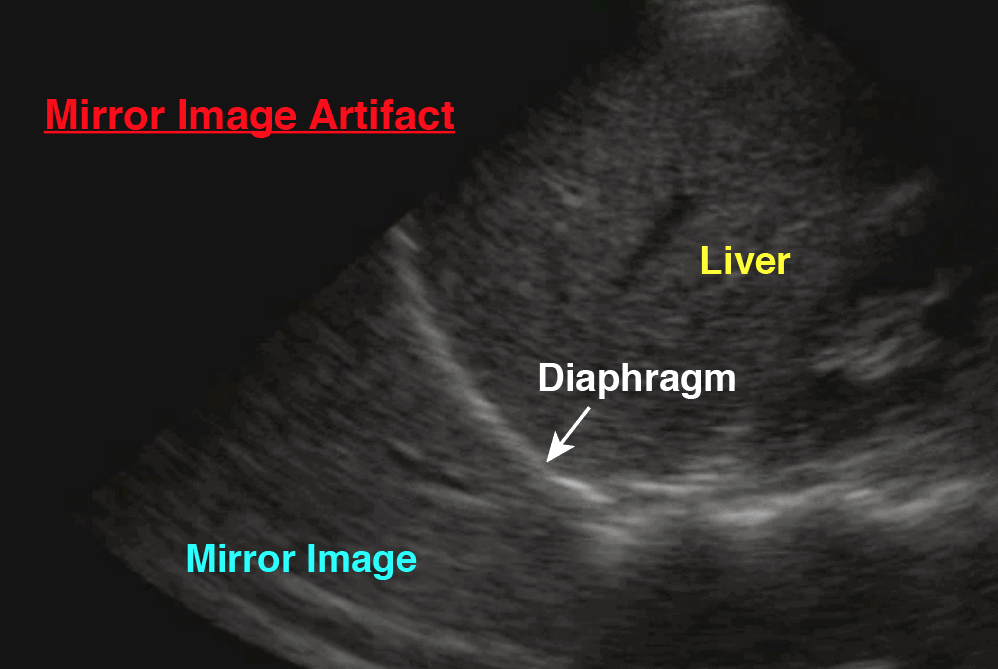
Mirror Image Artifact
The mirror image artifact on ultrasound occurs when ultrasound waves encounter a highly reflective surface that is adjacent to air.
The most common instance of this is the pleural-diaphragm interface causing the appearance of “liver” or “spleen” inside the lung. You can also see mirror image artifact when you are performing cardiac ultrasound as the ultrasound waves, approach the pleural-pericardium interface. These are normal findings.

Acoustic Shadowing Artifact
Acoustic shadowing occurs when ultrasound waves encounter a structure that has a high attenuation coefficient.
You will most commonly encounter the acoustic shadowing artifacts in the following structures: bones, ribs, and gallstones.

Posterior Acoustic Enhancement
This is the opposite of the acoustic shadowing artifact and occurs when ultrasound waves pass through a structure with significantly low attenuation such as blood or fluid-filled structures.
The most common situation you will see posterior acoustic enhancement: bladder, gallbladder, cysts, vessels, ocular ultrasound.

Edge Shadowing Artifact
Edge artifact on ultrasound occurs because of refraction. Ultrasound waves are deflected from their original path when they encounter curved and smooth-walled structures. This will result in a shadow-like line that comes off of the edge of these structures. The most common times you will see this are: vessel walls, gallbladder, cystic structures, testicle, aorta.
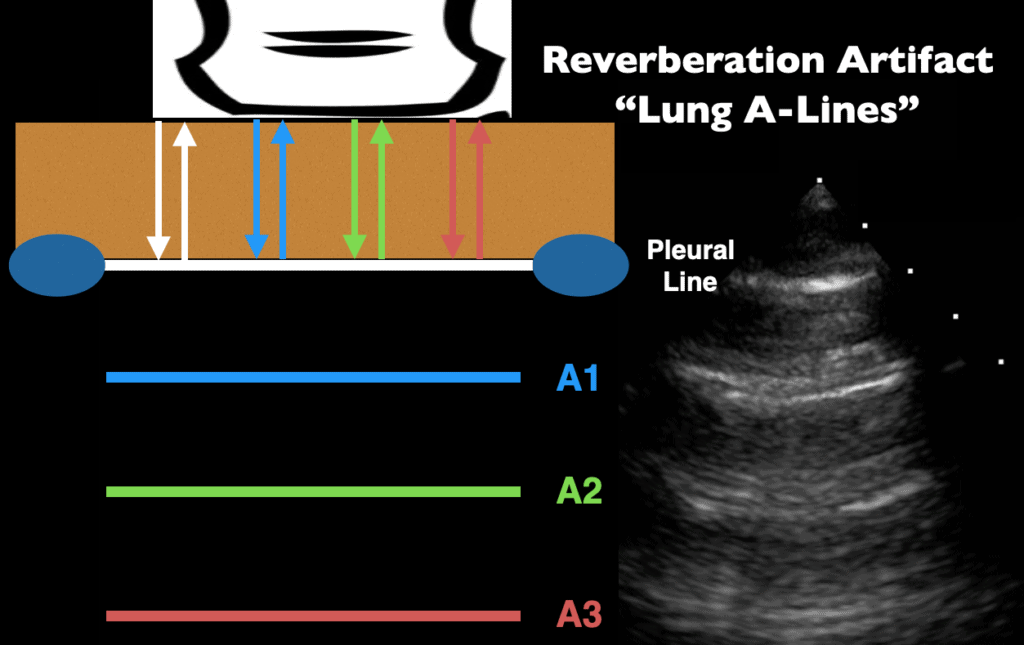
Reverberation Artifact
In the presence of highly reflective surfaces, echoes may reflect back and forth between the reflective surface and the ultrasound probe. This can cause the ultrasound screen to record and display multiple echoes on the screen. This ultrasound artifact is known as Reverberation Artifact.
Let’s use the highly reflective pleural line as an example below. The ultrasound waves that return after a single reflection represents the actual pleural line (white arrows/line in the figure below). All of the subsequent echoes (blue, green, and red arrows/lines) will take longer to return the probe and the ultrasound will interpret those as increased equidistantly spaced linear reflections. These other lines are also known as “A-lines” and are a form of reverberation artifact in normal lung.
Comet Tail Artifact
Comet tail artifact is a form of reverberation artifact. In comet tail artifact the two reflective surfaces are closely spaced together (such as the bevel of a metallic needle). The reflective surfaces are so close that it is difficult to distinguish between each reflected echo.
Comet tail artifact is different from ring down artifact (described next) because the comet tail artifact dissipates with depth and has a triangular and tapered shape. See the image below of a comet tail artifact arising from a needle tip.

Ring Down Artifact
Previously, the ring down artifact was thought to be a type of comet tail artifact, since both have bright “echogenic” lines arising from a specific location. However, the ring down artifact has a distinct feature compared to the comet tail artifact in that the echos do NOT dissipate as the depth of the image is increased. These echogenic vertical lines will go all the way to the bottom of the screen, regardless of depth. This has become known as the “ring down artifact” and is most commonly seen as “B-lines” in lung ultrasound, signifying interstitial edema.
The theory for the ring down artifact is that when fluid is trapped in a tetrahedron of air bubbles, the ultrasound waves reflect infinitely and result in an infinitely long vertical echogenic line.

Side lobe Artifact
Side lobe artifact occurs when the beam of an off-axis side lobe encounters a structure and returns this off-axis object as coming from the main beam. This creates a duplicate structure on the screen but in a different area.
In the example below, it seems like there is a moving structure in the left atrium, but it is actually a side lobe artifact resulting from the mitral valve leaflet. This is important because oftentimes these side lobe artifacts may be mistaken for clots or foreign bodies. It is always a good habit to get multiple views to confirm that what you are seeing is artifact versus pathology.

Best Ultrasound Physics Book Reference – Sidney K. Edelman PhD
I hope you found this ultrasound physics post helpful and clinically relevant. Of course, I could not cover every detail of ultrasound physics in one post, but if you went through this post you will have all the ultrasound physics basics to help your scanning.
However, if you want to learn more about ultrasound physics, I would recommend checking out this book by Sidney K. Edelman PhD. It will go over all of the ultrasound physics you could ever want but in a very reader-friendly way. It’s definitely a staple on my ultrasound bookshelf!

References
- Understanding Ultrasound Physics book by Sidney K. Edelman PhD
- Steel, R., Poepping, T., Thompson, R., Macaskill, C. (2004). Origins of the edge shadowing artefact in medical ultrasound imaging Ultrasound in Medicine & Biology 30(9), 1153-1162. https://dx.doi.org/10.1016/j.ultrasmedbio.2004.07.014
- Feldman, M., Katyal, S., Blackwood, M. (2009). US artifacts. Radiographics : a review publication of the Radiological Society of North America, Inc 29(4), 1179 – 1189. https://dx.doi.org/10.1148/rg.294085199
(Special thanks to Kimberly Ayers RDCS for reviewing this post)


Great post. Thanks!
No Problem! Glad you found it helpful 🙂
Thanks for the refresher, makes it seem simple.
Thanks Susan for the feedback! Yes I’m glad you find it simple 🙂
I truly thank you for your post since it helps me comprehend the whole picture! I studied and comprehended each concept but I couldnot find the relationships between them to help me understand ultrasound physics. Thank you for your post very much. Happy Holodays.
Thank you so much Helen! Appreciate the kind words and glad it could help.
I want to share with you that I have passed the SPI exam yesterday, 622/700 (89%). Your posts have helped me a lot. Thank you so much. I hope you will maintain to post helpful posts like these!
I’m a doctor in the UK and your articles have been fantastic! I’m keen to give ultrasound a go on my intensive care rotation!
That’s great to hear Krish!! Hope your rotations are going well and that these articles help!
Great illustration
.thank you.
Thanks so much Firew for the comment!
thank you, you’re the best!
Thank you and appreciate the kind words